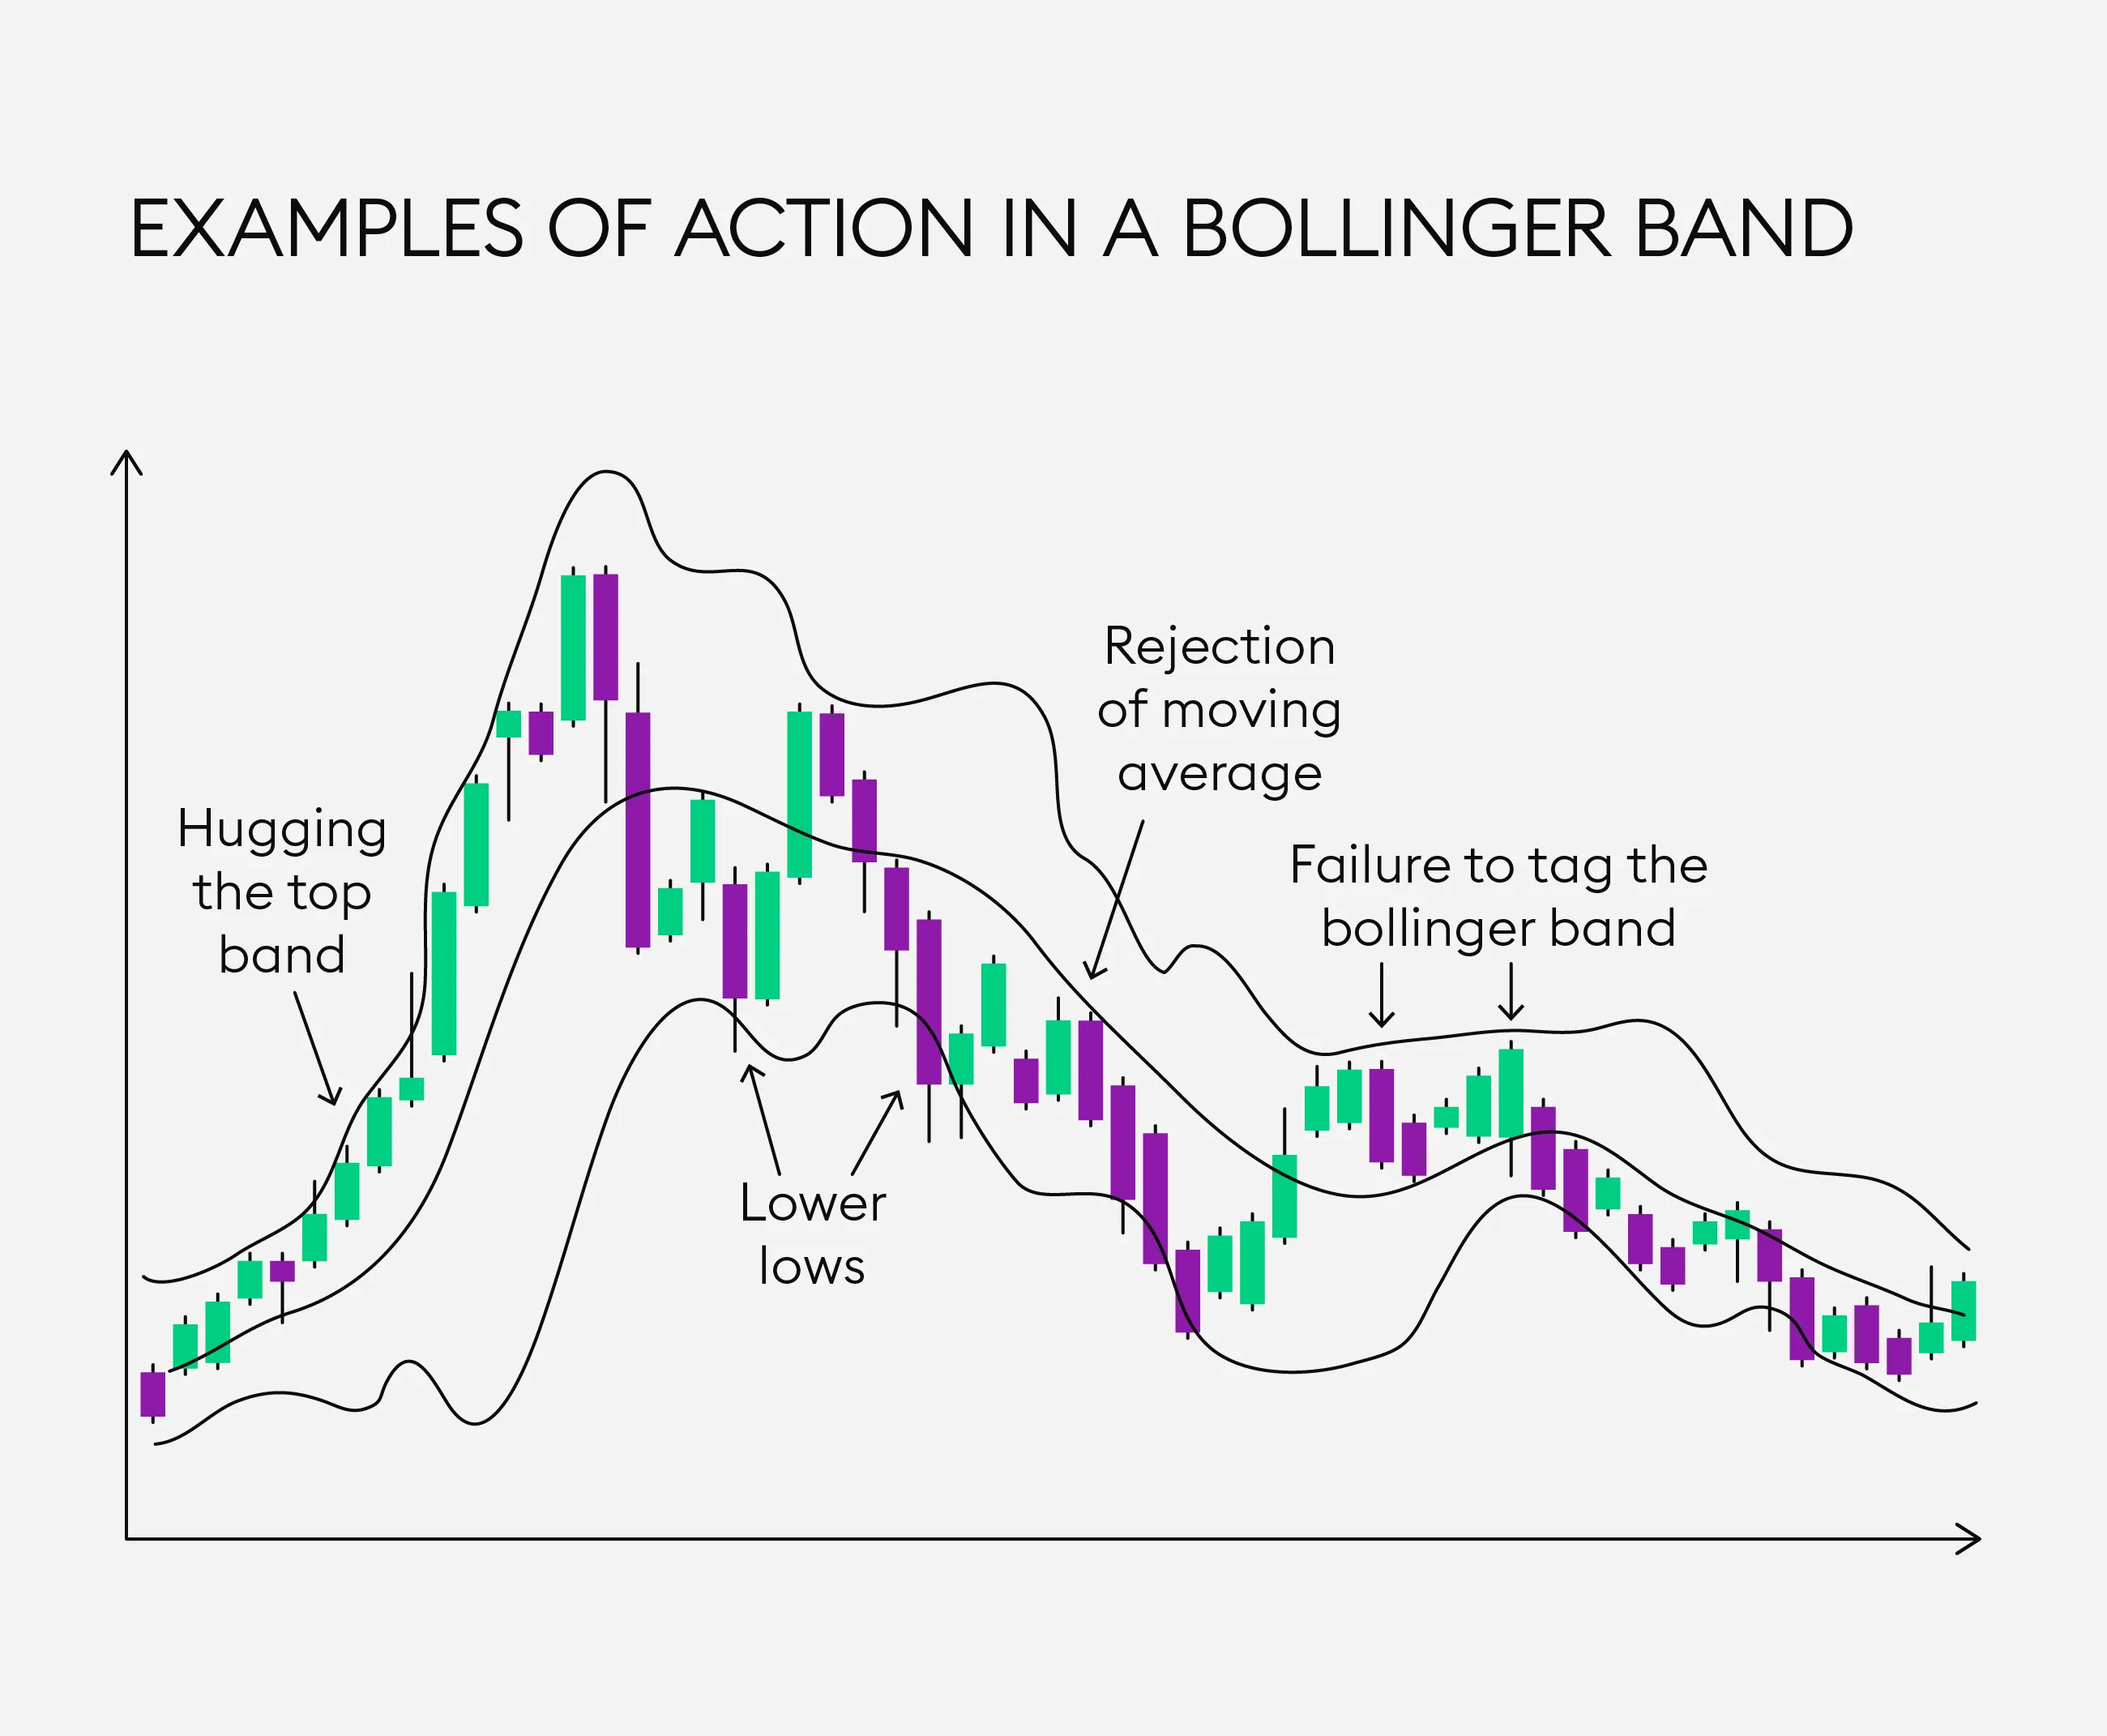
Mastering the Art of Volume Analysis Through Screenshots
Volume analysis is a cornerstone technique for many traders who want to understand market dynamics beyond just price action. But how do you effectively communicate complex volume insights to your audience or clients? Enter the power of screenshots. By capturing and presenting clear, data-rich snapshots, you can highlight key volume patterns, build trust, and enhance your trading education or signal services.
Why Use Screenshots for Volume Analysis?
Imagine you’re explaining the significance of a volume spike during a price breakout. Words alone can get lengthy and abstract. A well-crafted screenshot brings immediate clarity:
- Visual clarity: Charts with highlighted volume zones help users see rather than just hear.
- Educational impact: Screenshots can freeze complex moments in time to dissect and discuss.
- Professionalism: Clean, annotated images enhance credibility, essential for educators and influencers.
- Shareability: Easily postable on social media, blogs, or in signal groups to boost engagement.
In fact, according to a study from the National Center for Biotechnology Information, humans process images 60,000 times faster than text. So don’t underestimate the power of a captivating screenshot in driving your teaching and signals home.
Step-by-Step Guide: How to Use Screenshots in Volume Analysis
1. Select the Right Moment on MetaTrader
First things first, open your MetaTrader platform and locate the trade or volume activity you want to showcase. This could be:
– A volume surge at breakout points
– Volume confirming trend reversals
– Divergence between volume and price
For example, a sudden upward volume burst during a bullish engulfing candle can indicate institutional buying pressure—a perfect teachable moment.
2. Highlight Volume Areas
Use your charting tools to draw attention to critical volume zones. Circle high volume bars, shade clusters, or add arrows pointing to unusual activity. Some traders annotate with notes like “Volume spike confirms breakout” or “Low volume warns of false move.”
Pro tip: Keep annotations concise but informative. Cluttered screenshots can overwhelm and confuse your audience.
3. Capture a Clean and Professional Screenshot
This is where Trading Screenshot Generator becomes invaluable. Instead of fumbling with multiple windows or cropping manually, this tool lets you generate high-quality, customizable screenshots directly from MetaTrader.
- Choose your preferred chart style and time frames.
- Add or remove indicators including volume to tailor your visual.
- Brand the screenshot subtly with your logo or watermark to build trust.
Creating professional screenshots in seconds means you can consistently produce credible, share-worthy content with less hassle.
Practical Examples of Using Screenshots for Volume Insights
Volume Confirmation of Breakouts
Volume spikes at breakout points confirm the validity of moves. A screenshot highlighting the volume bar’s surge against a price breakout can immediately convince your audience of the trade’s strength.
Volume Divergence to Spot Reversals
Oftentimes, price makes a higher high but volume declines—a classic sign of weakening momentum. A well-marked screenshot can effectively communicate this subtle nuance.
Volume Clusters Indicating Strong Support or Resistance
Volume often accumulates in clusters near key support/resistance zones. Capturing these clusters in a screenshot allows readers to understand potential supply/demand zones visually.
Tips to Maximize Impact When Sharing Volume Screenshots
- Context Matters: Always explain what the volume pattern means. Don’t assume all viewers understand volume theory.
- Annotate Wisely: Use arrows, text boxes, or color highlights but avoid clutter.
- Consistency Builds Recognition: Create a visual style unique to your brand for immediate identification.
- Embed in Educational Materials: Add screenshots to blog posts, video tutorials, or newsletters.
- Encourage Interaction: Pose questions or invite interpretations to engage your audience.
Example Caption Enhancements
Instead of posting a raw chart, try captions like:
- “Notice how volume surged exactly at resistance breakout—this validates the strength of the move.”
- “Volume divergence warns of possible reversal—be cautious entering long positions here.”
How Screenshots Enhance Trust and Conversion for Signal Providers
In an industry rife with skepticism, visual proof is critical. When you demonstrate volume-based trade setups with professionally crafted screenshots, you:
- Boost transparency: Show your methodology at work, not just the results.
- Build rapport: Followers appreciate honesty and educational value.
- Drive conversions: Clear evidence encourages sign-ups and subscriptions.
One of the anecdotes I often share involves a financial influencer who doubled his subscriber base simply by integrating volume-annotated screenshots consistently into his daily trade recaps. It made his signals feel accountable and data-driven, standing out in a crowded market.
Wrapping It Up: Why You Should Start Using Screenshots Today
If you’re still relying solely on text or raw charts, you’re missing out on a huge opportunity to clarify your volume analysis and build an authentic connection with your audience. With tools like Trading Screenshot Generator, creating polished, detailed volume screenshots is easier than ever.
Start capturing those decisive volume moments now and watch how your educational content or trade signals gain clarity, trust, and engagement.
Ready to elevate your volume analysis presentations? Try Trading Screenshot Generator today and harness the power of professional-grade visuals.


